Introducing 'CrimeMap'
Using R, Shiny and ShinyApps for Quick Web App Development
Jo-fai Chow (University of Exeter & XP Solutions)
Final Year EngD Candidate in Hydroinformatics (Water + Machine Learning)
Agenda
Why R? Introducing 'CrimeMap' What's Next? Beyond Data and Maps Conclusions Q & A

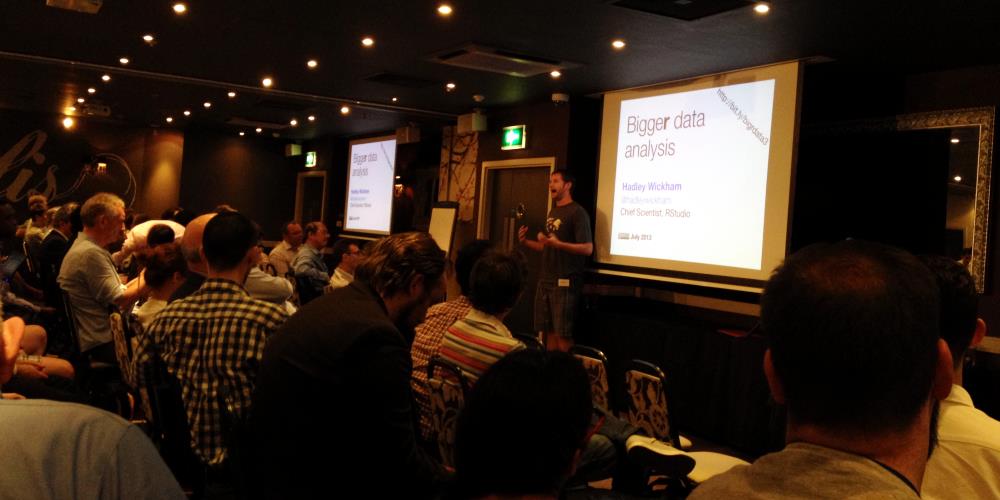
Above: Hadley Wickham's LondonR talk on dplyr and ggvis back in July 2013 (my first ever LondonR experience).
Why  ?
?
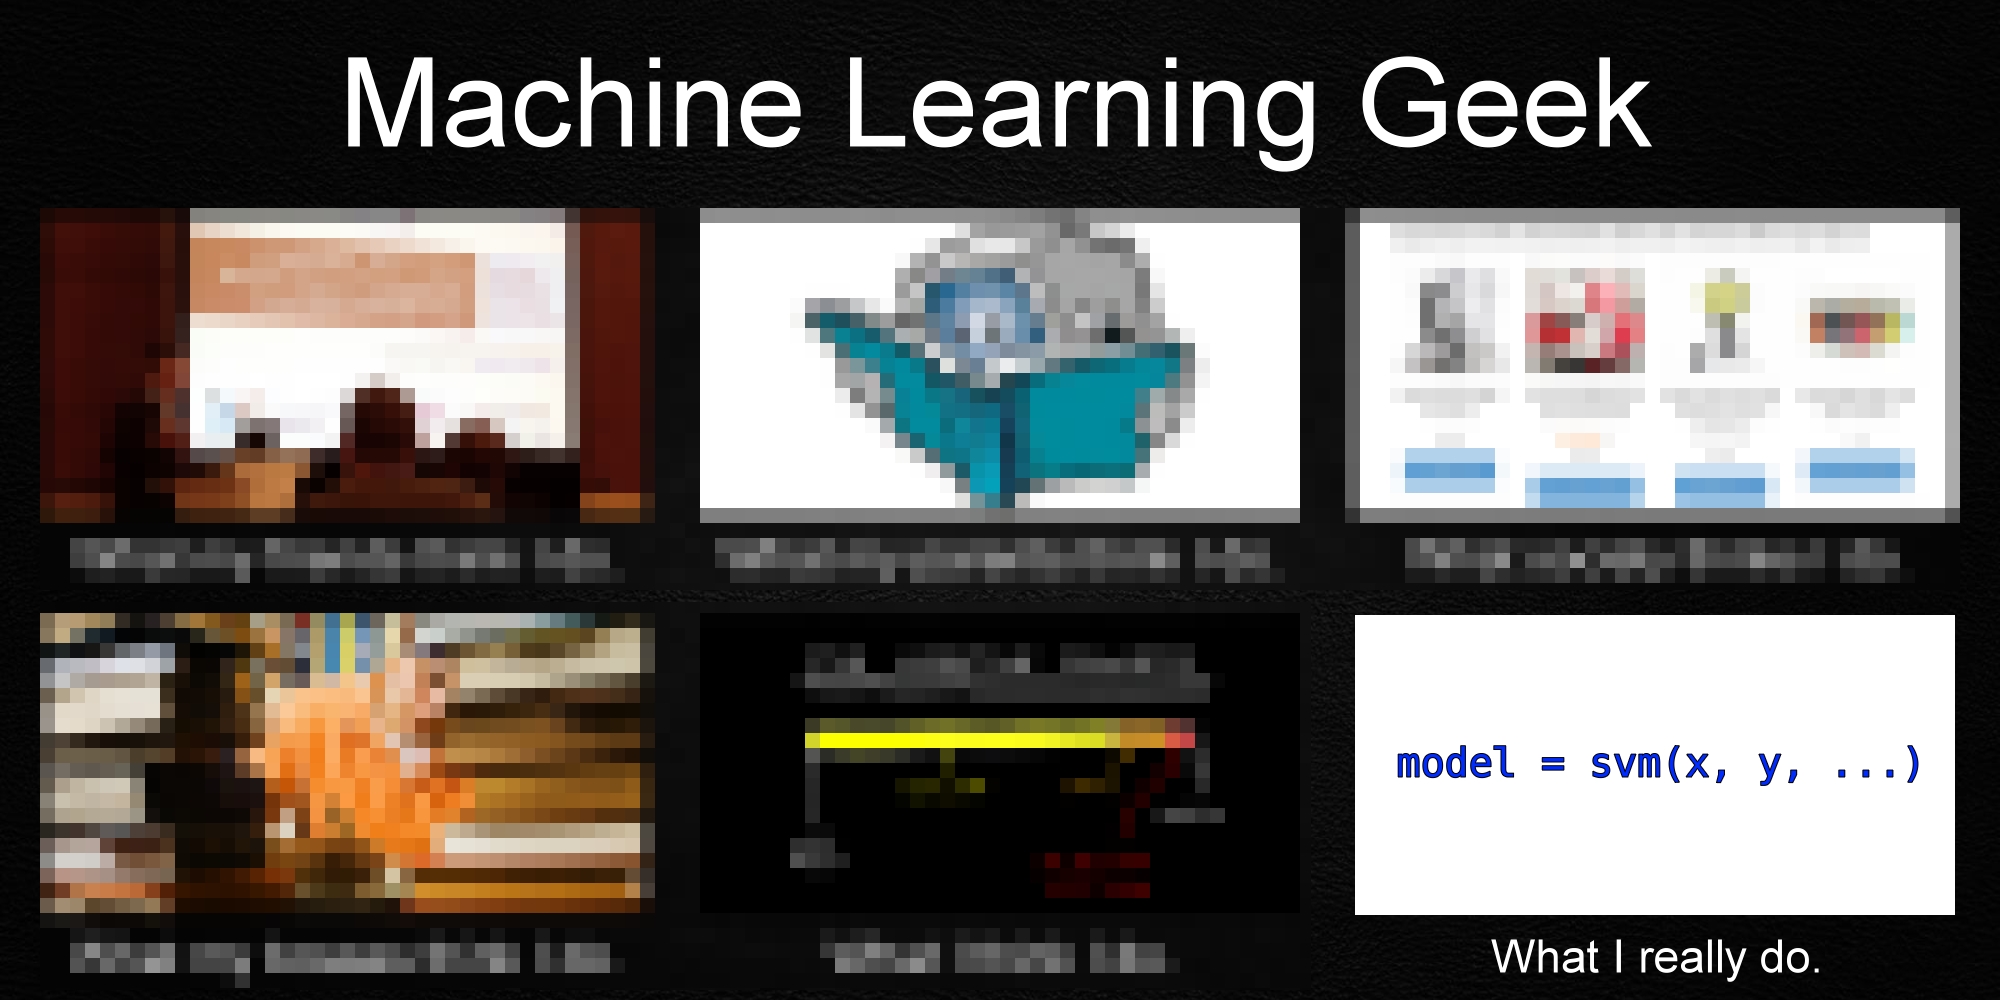
What People Think I Do
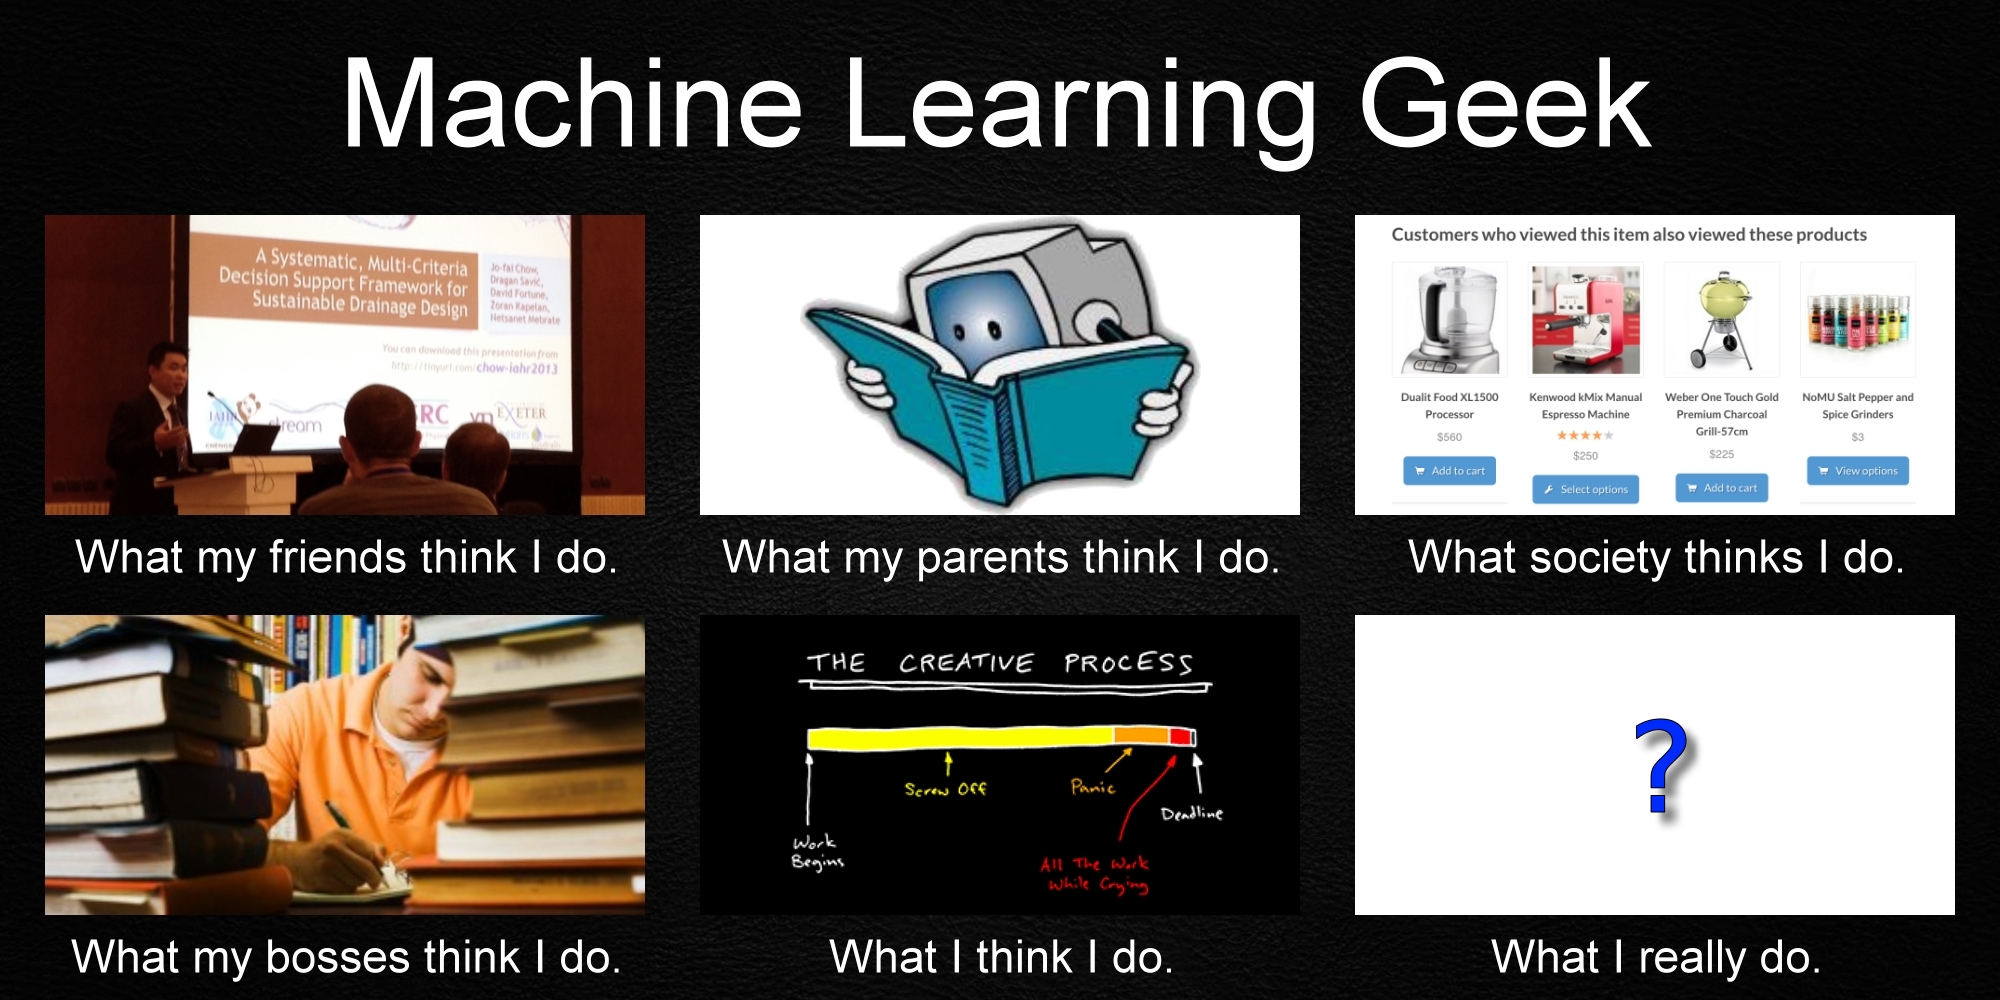
What People Think I Do
R Can Do That ?

Thanks to Tal Galili's

Taking My Leap of Faith (Jan - Mar 2013)
MOOC by Jeff Leek
Practical data analysis using R
Peer reviewed assignments
Kaggle Competition
- Data Manipulation (reshape2, plyr)
- Machine Learning (caret)
- Parallel Processing (foreach, doSNOW)
- Big Data (bigmemory, ff, RHadoop)
- Visualisation (rCharts, ggplot2, animation)
- Dynamic Documentation (knitr, roxygen2)
- User Community (LondonR)
- Active Development of New Packages (ggvis, dplyr, SparkR ...)
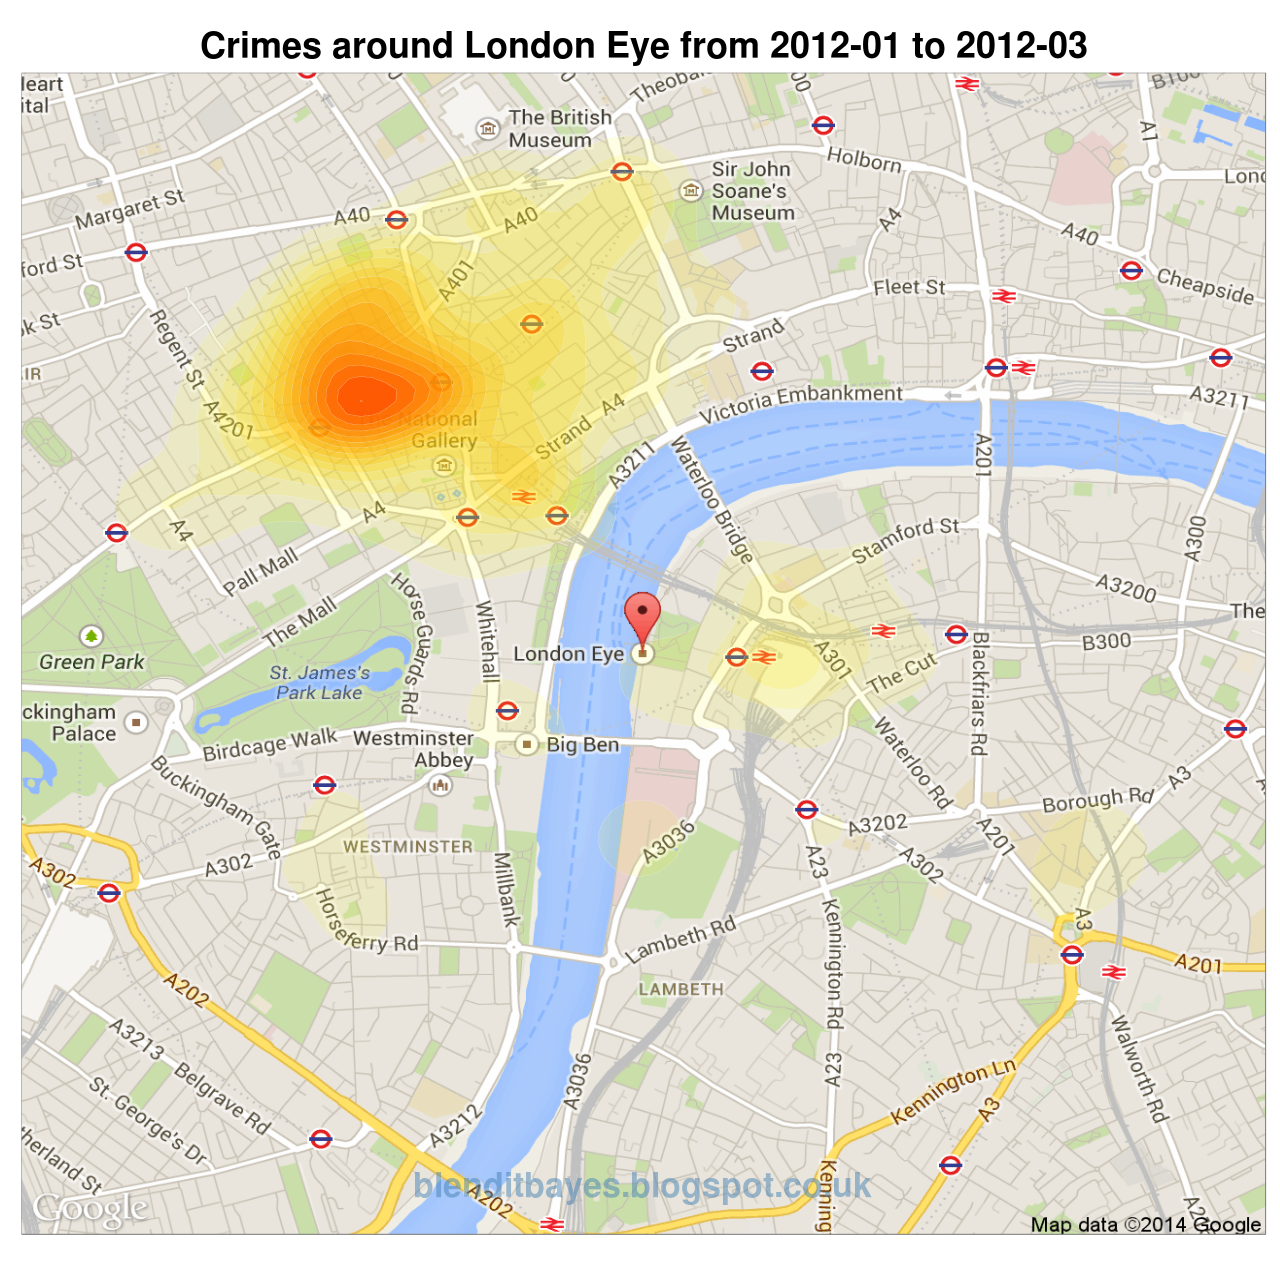
Introducing 'CrimeMap'
CrimeMap - The Original by David Kahle
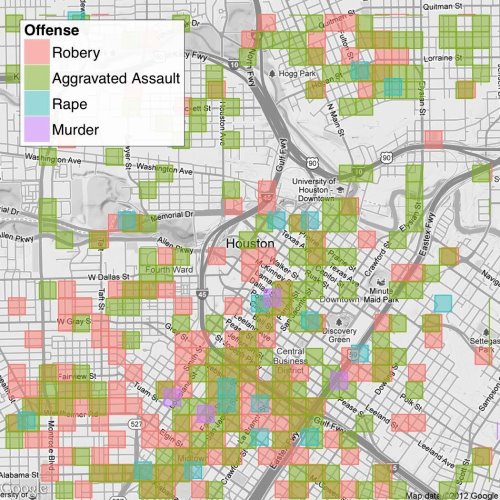
CrimeMap - Maybe I can try it with different data?
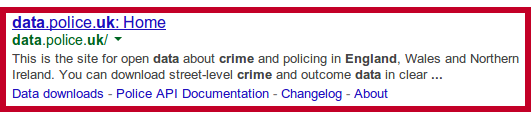
Download crime data within a 1 mile radius of a single point (JSON)
http://data.police.uk/api/
       crimes-street/all-crime?
      lat=52.629729&
      lng=-1.131592&
      date=2012-04
{"category" : "anti-social-behaviour",
 "month"    : "2012-04",
 "location" : {
  "latitude"  : "52.640374",
  "longitude" : "-1.122319",
  "street"    : {
   "id"   : 884330,
   "name" : "On or near Christow Street"}},
  ... and some other stuff}
Specific area (JSON) and batch download (CSV).
Putting it together!
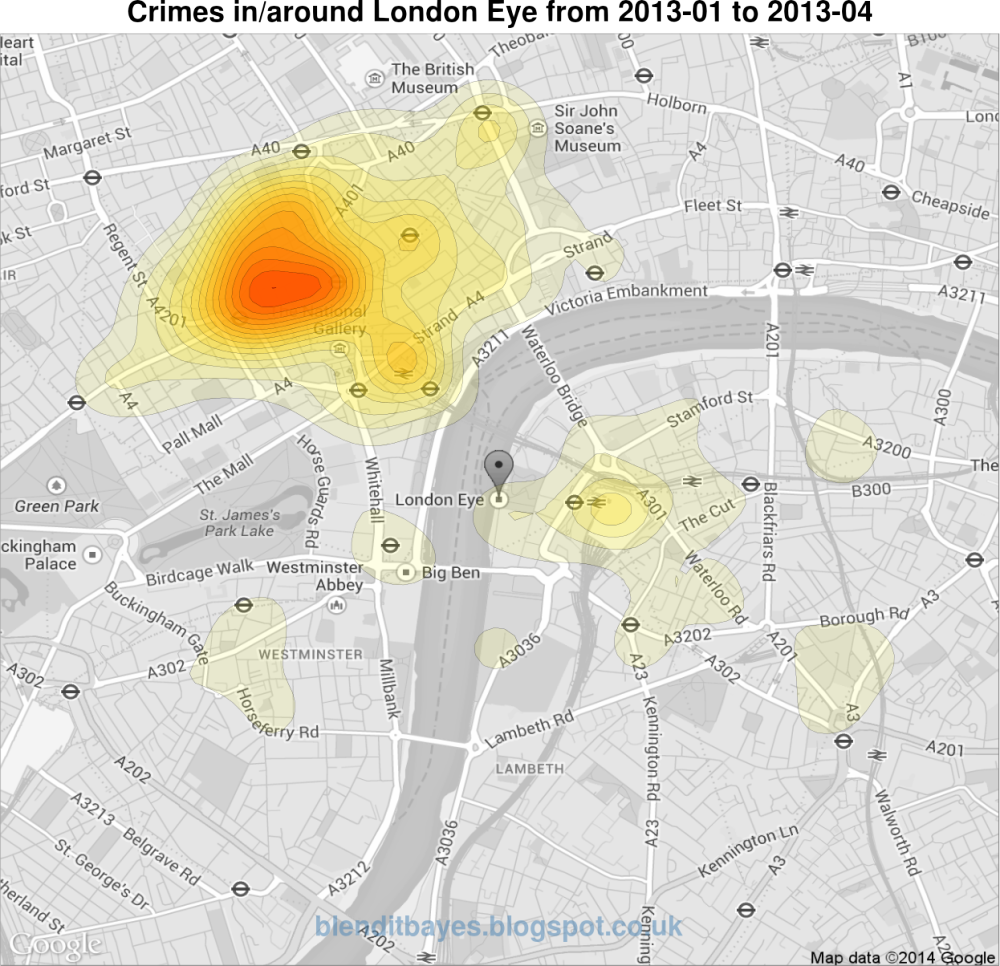
First Milestone: A Wrapper Function (June 2013)
crimeplot.wrapper <- function(
## user-defined location
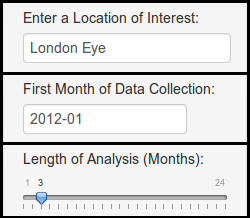
point.of.interest = "London Eye",
## period of time in YYYY-MM
period = c("2013-01","2013-02",
"2013-03","2013-04"),
## terrain, satellite, hybrid
type.map = "roadmap",
## month, category, type
type.facet = NA
...)
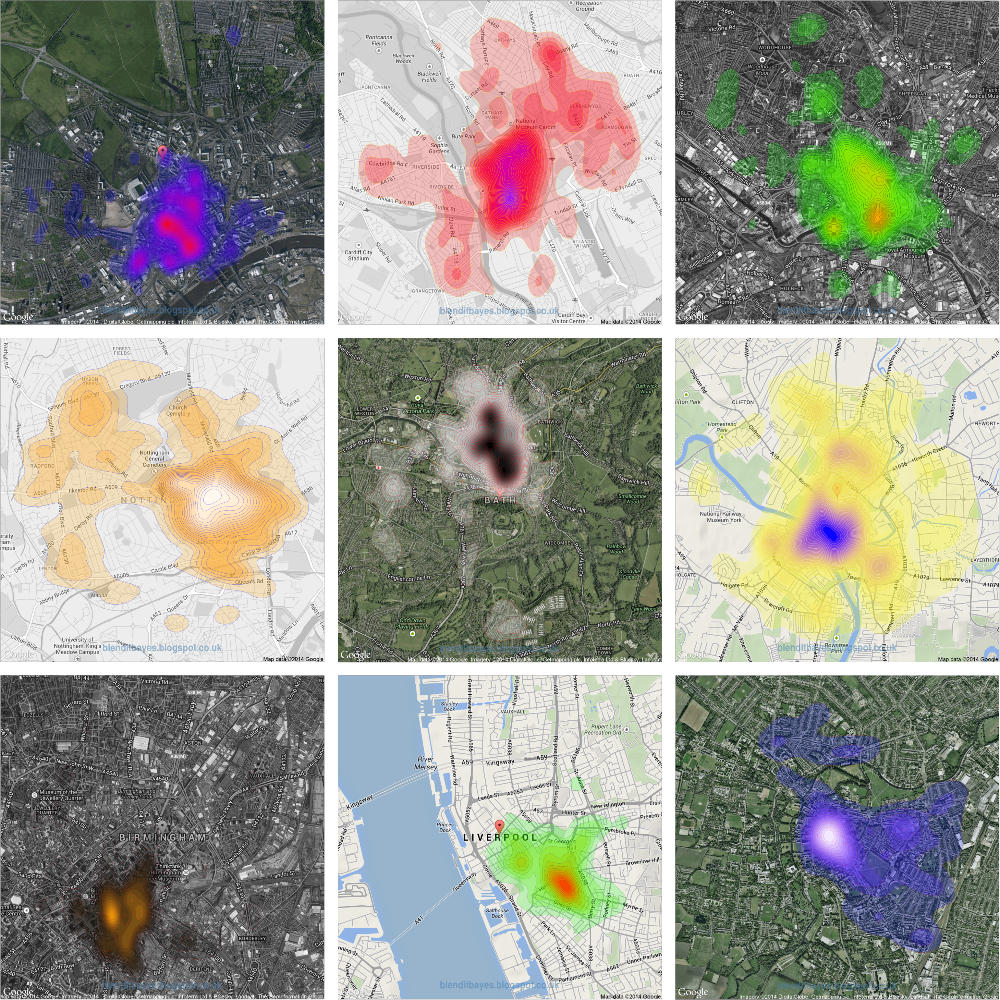
CrimeMap - Application Examples (Map Type)
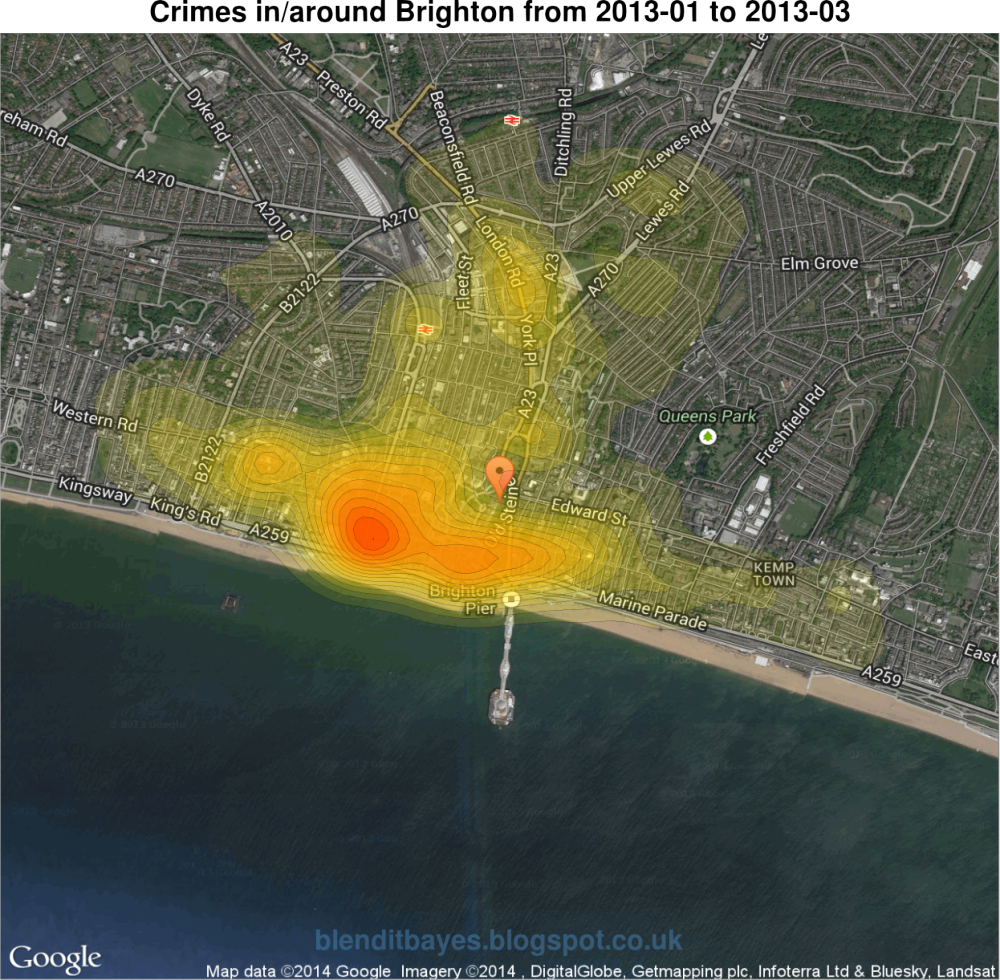
Brighton (Map: Hybrid)
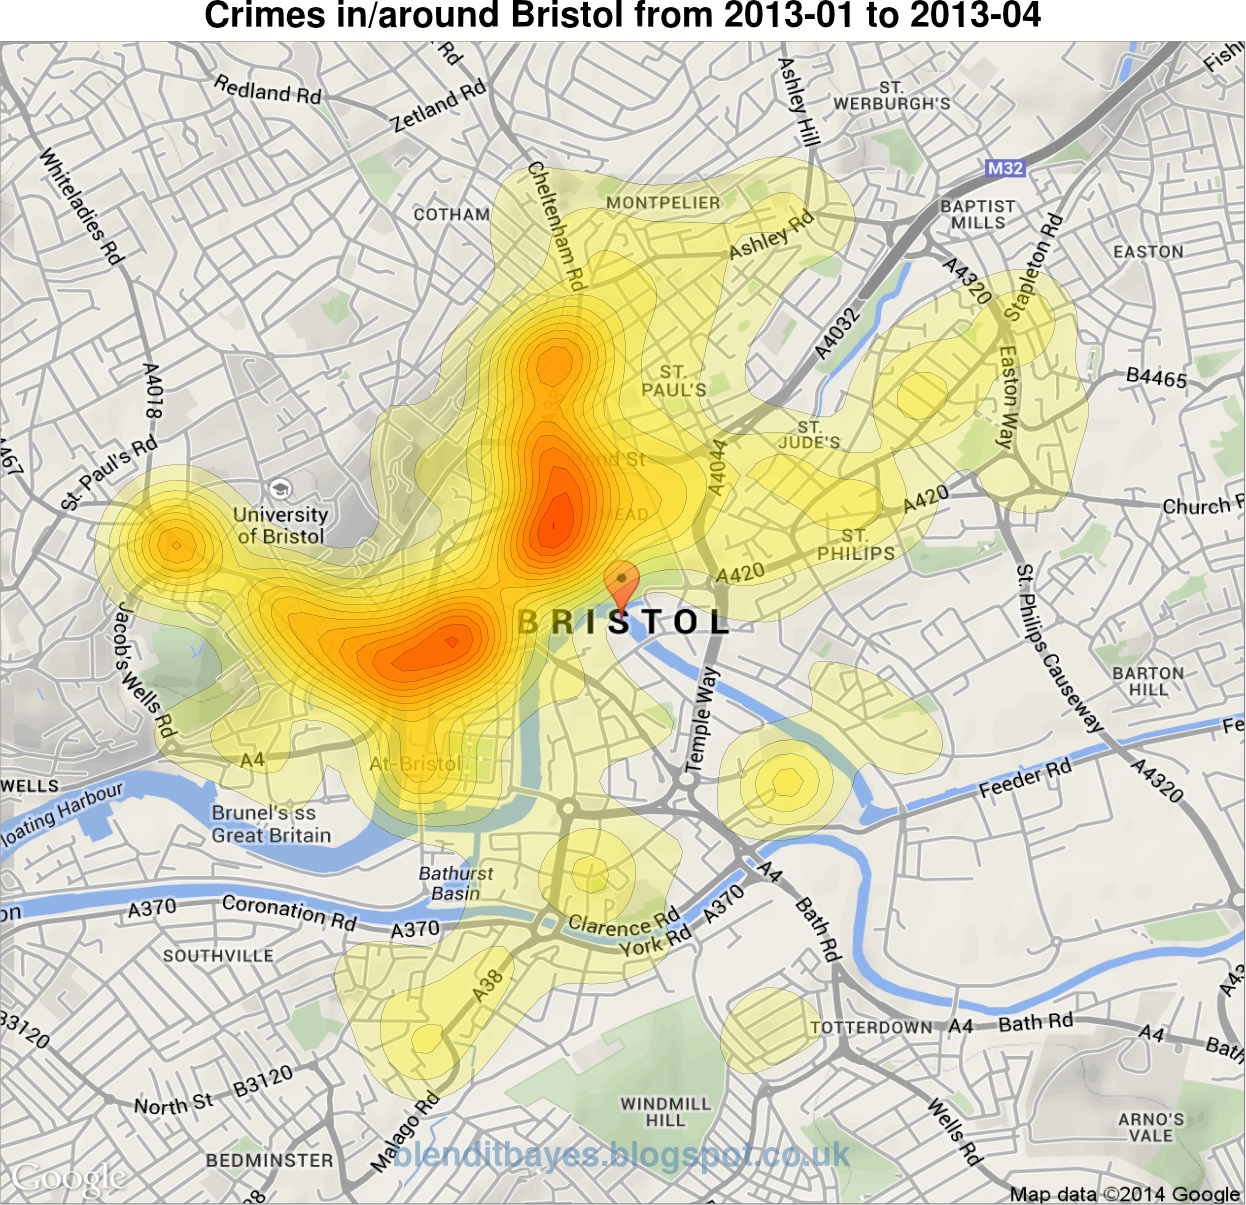
Bristol (Map: Terrain)
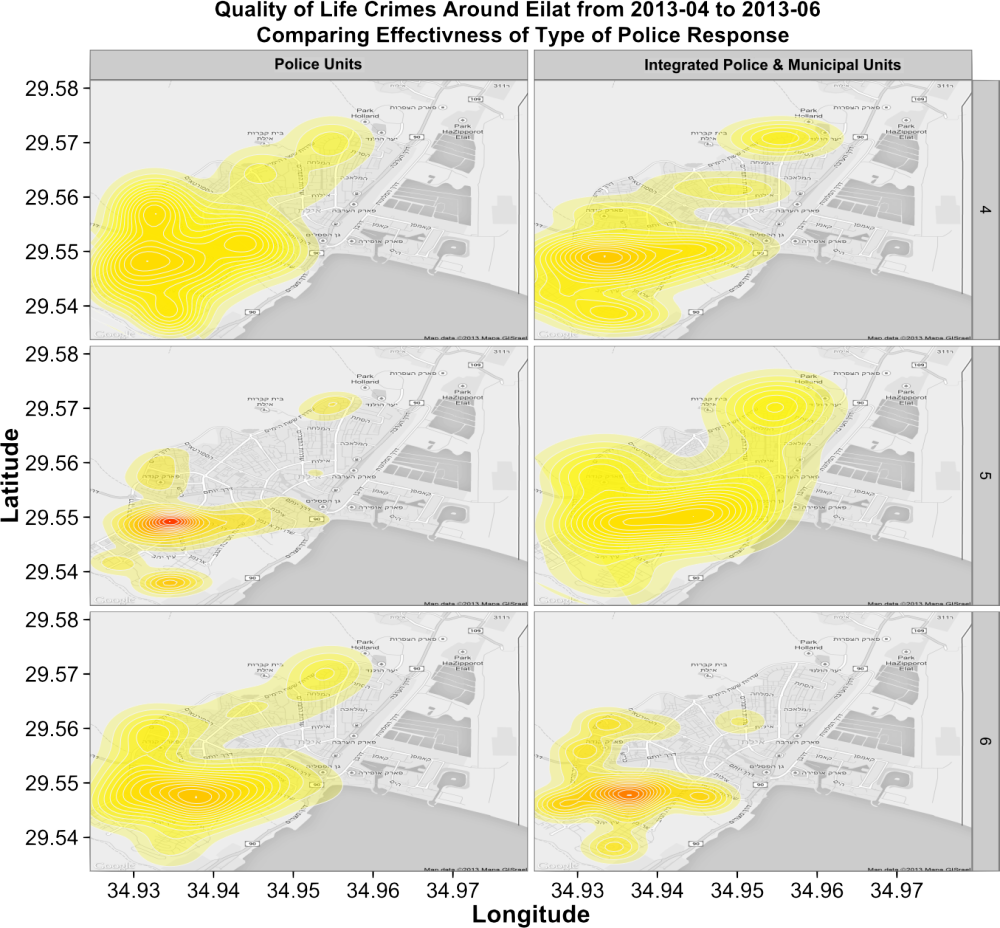
CrimeMap - Application Examples (Facet)
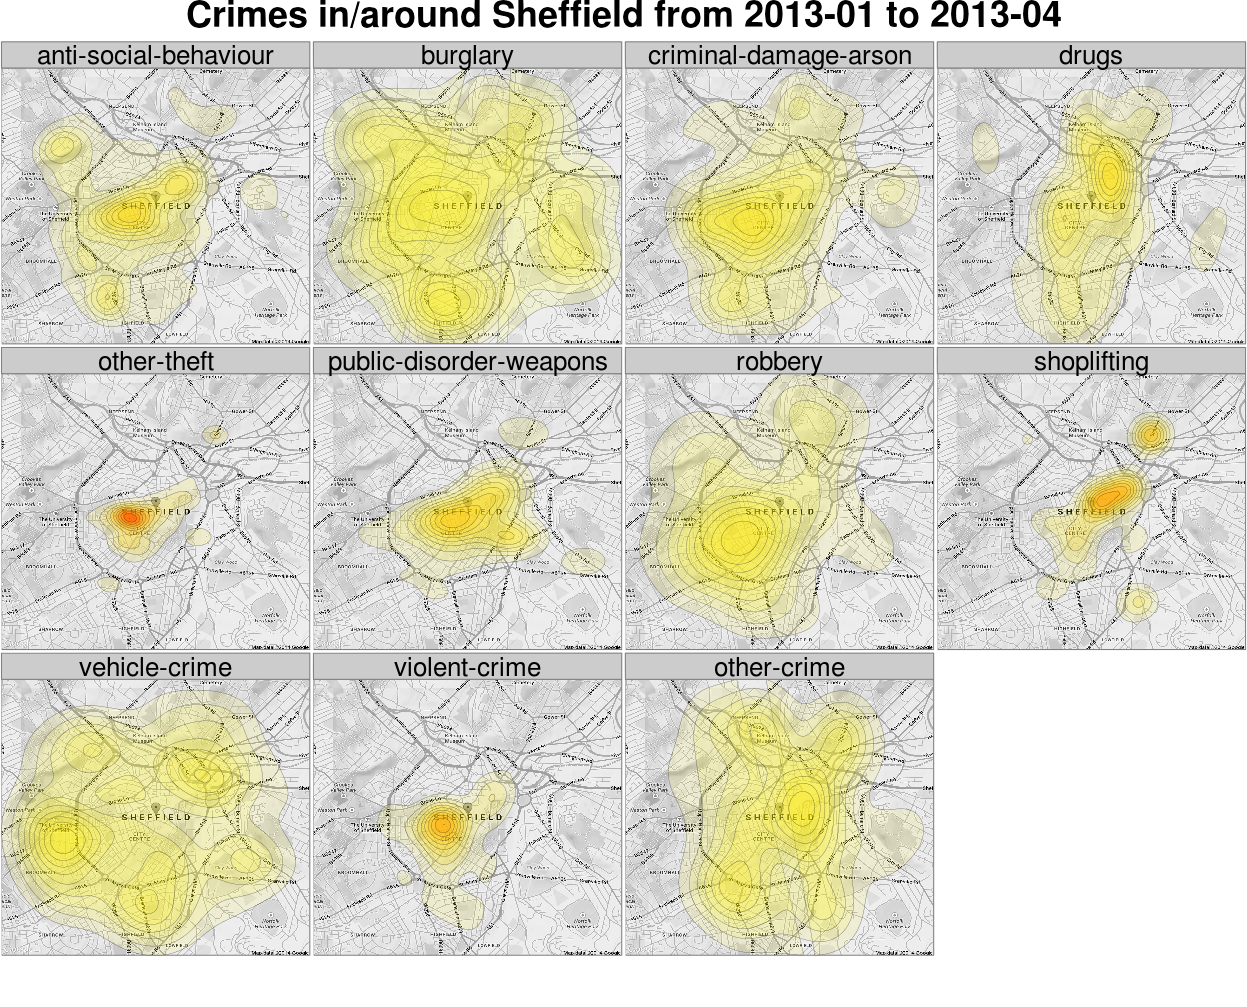
Sheffield (by Category)
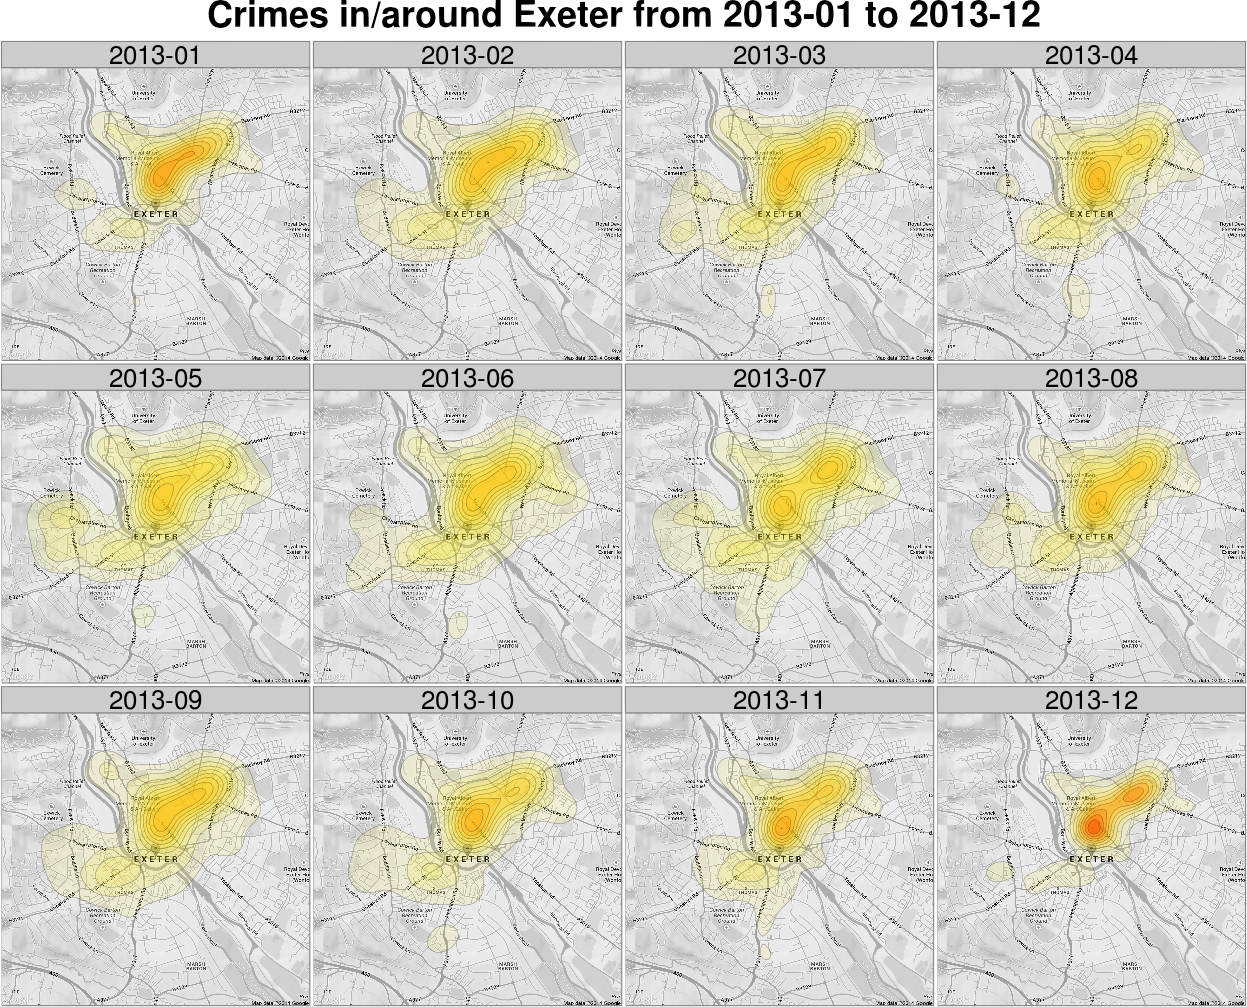
Exeter (by Month)
Making it Shiny!
CrimeMap - Making it Shiny!
"Shiny makes it super simple for R users like you to turn analyses into interactive web applications that anyone can use." - RStudio
"ShinyApps is a platform as a service (PaaS) for hosting Shiny applications ... allowing you to create your online account, and deploy your first Shiny application to the cloud." - RStudio
"It looks fun! Maybe I can learn a new trick!"
"Can I make it super user-friendly ... so easy that even my mom knows how to use it?"
"Is it really possible? I have NO prior web app development experience at all."
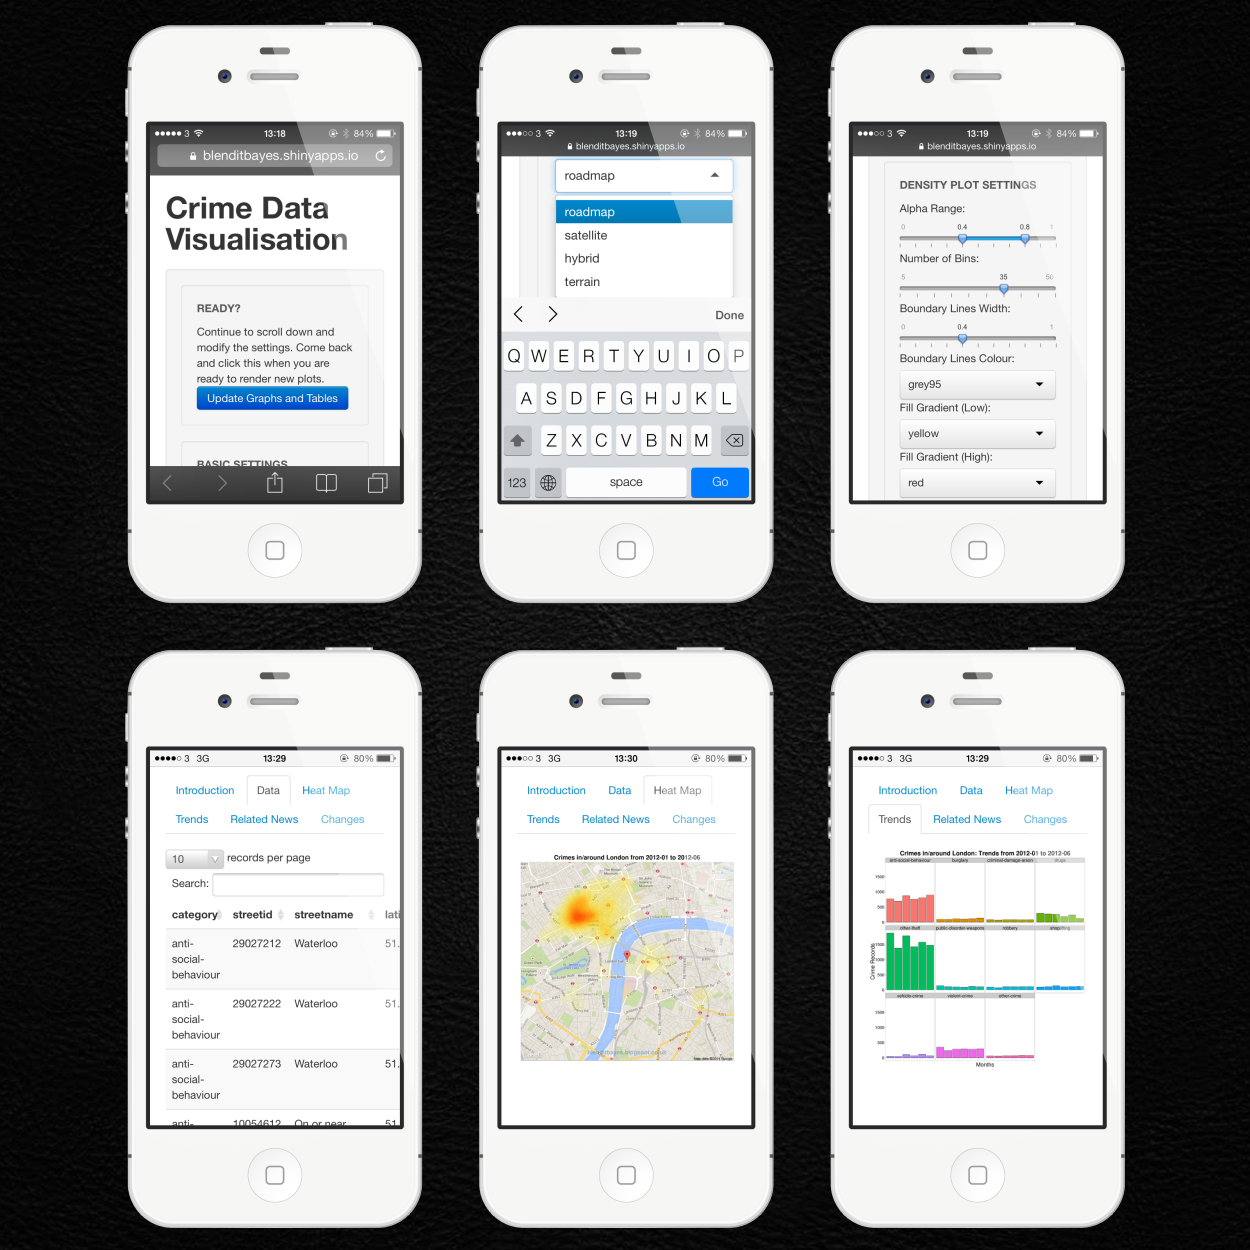
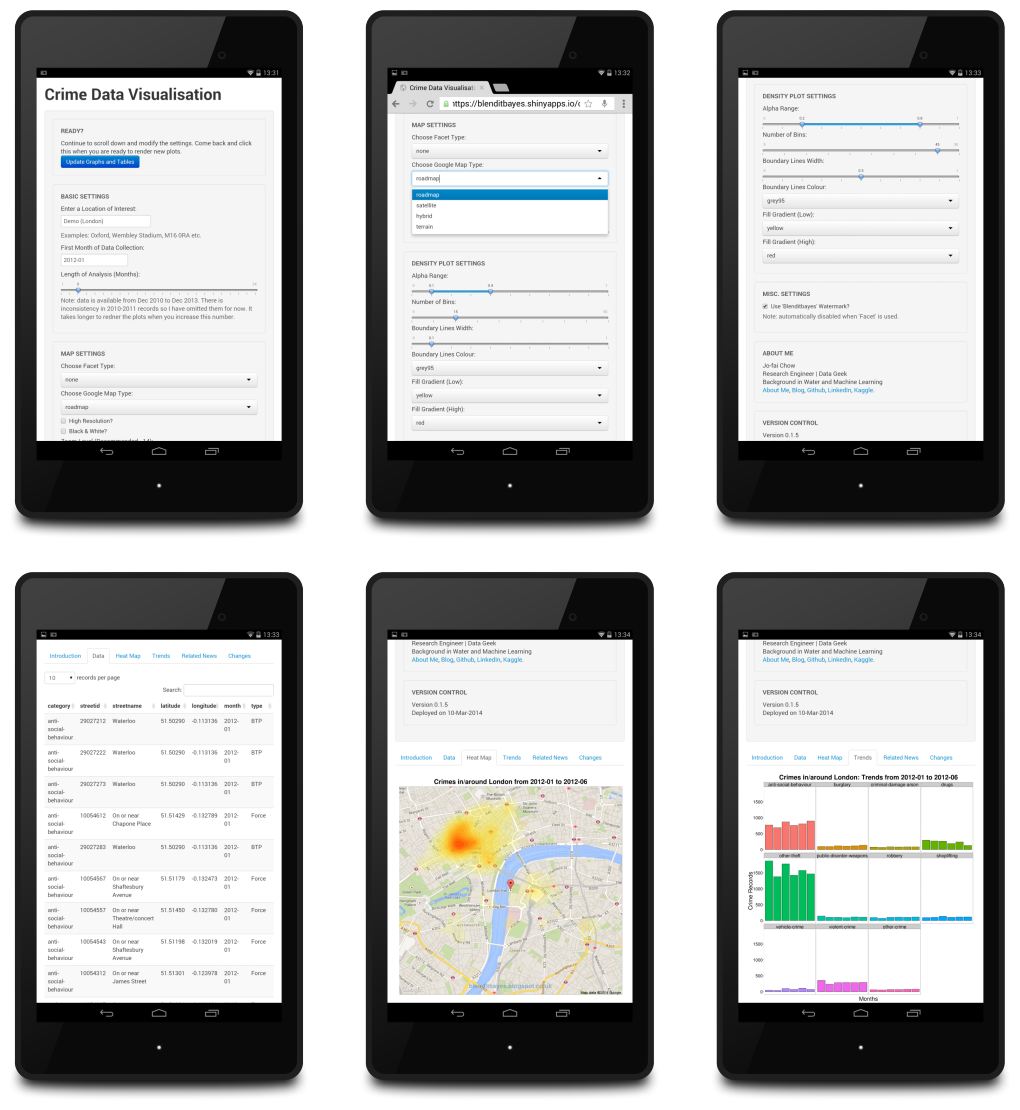
"Will it work on mobile devices?"
Second Milestone: Shiny Web App (Nov 2013)
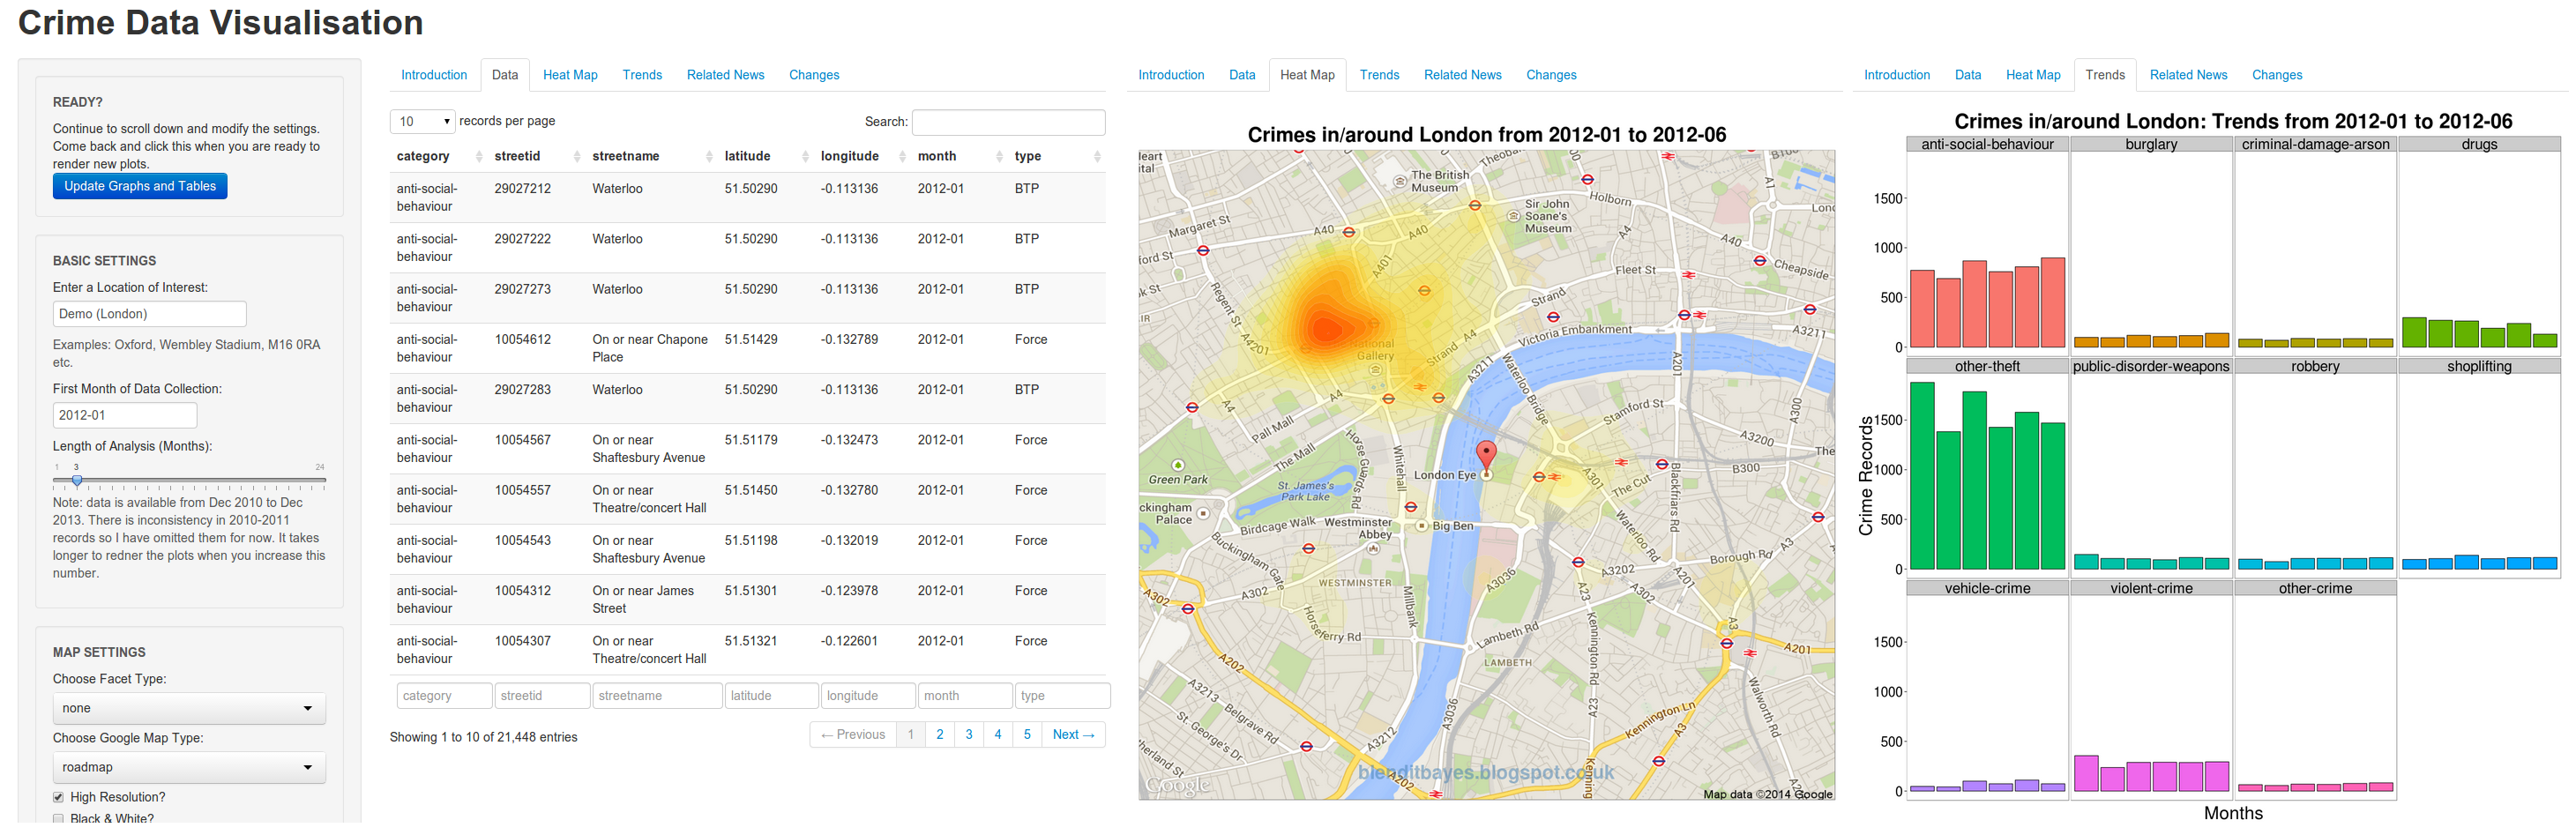
bit.ly/bib_crimemap
CrimeMap - Keep It Simple, Stupid

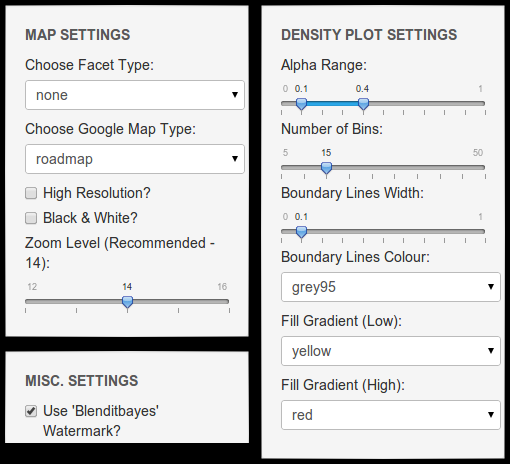
CrimeMap - Control Freak !!!
Sharing it with the world!
CrimeMap - Hosting it with ShinyApps
Set Credentials
setAccountInfo(name   = "blenditbayes",
               token  = "your_token",
               secret = "your_secret")
Deploy it!
deployApp(appDir  = "your_app_dir",
          appName = "your_app_name")
Configure Instance Type
configureApp(appName = "crimemap",
             size    = "xlarge")
CrimeMap - Using it on iPhone 4s & Nexus 7
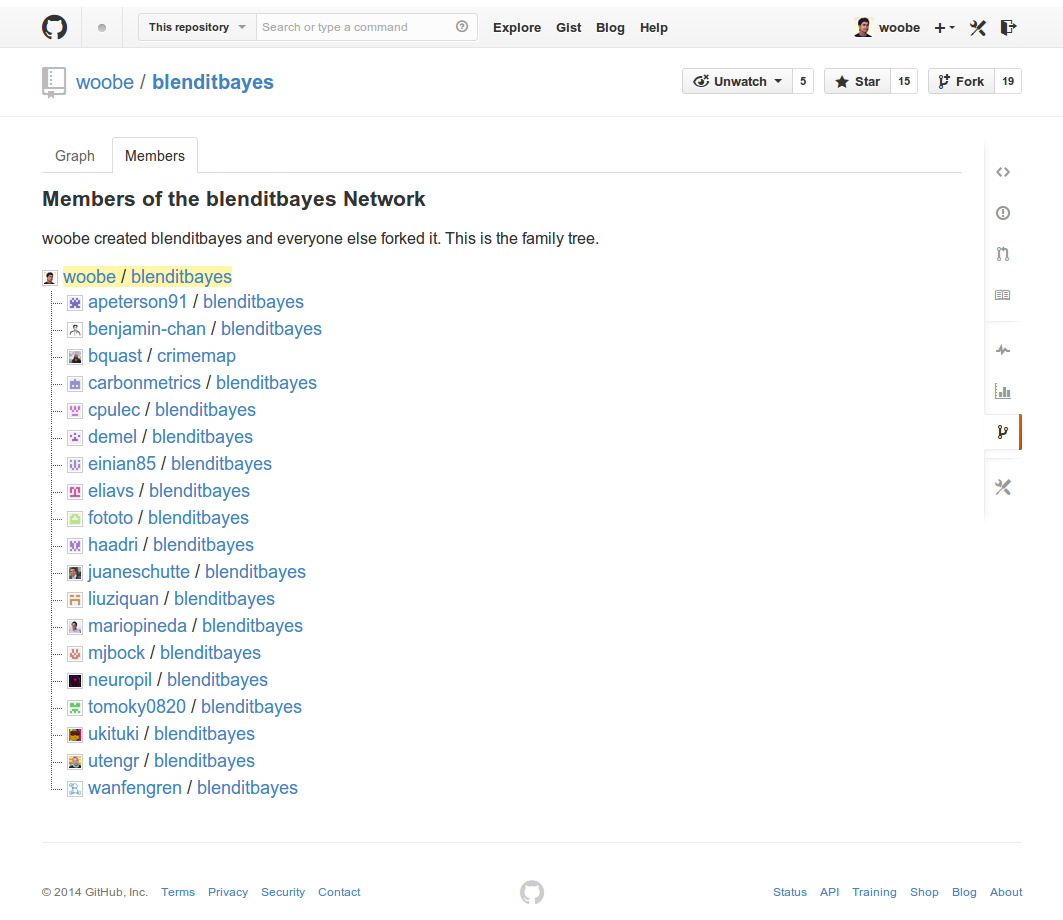
CrimeMap - Forked Projects
Summary of Experience
CrimeMap - Summary of My Shiny Experience
- Rapid development - from noob to my first web app in a few days!
- Default layout is nice and simple. You can further customise it with CSS.
- It works on mobile devices!
- Easy code sharing.
- Even my mom knows how to use it!!!
- Hassle-free. No need to worry about maintenance and data usage.
- Deploy (or update) your app in minutes.
- Great support from the RStudio team!
What's Next?
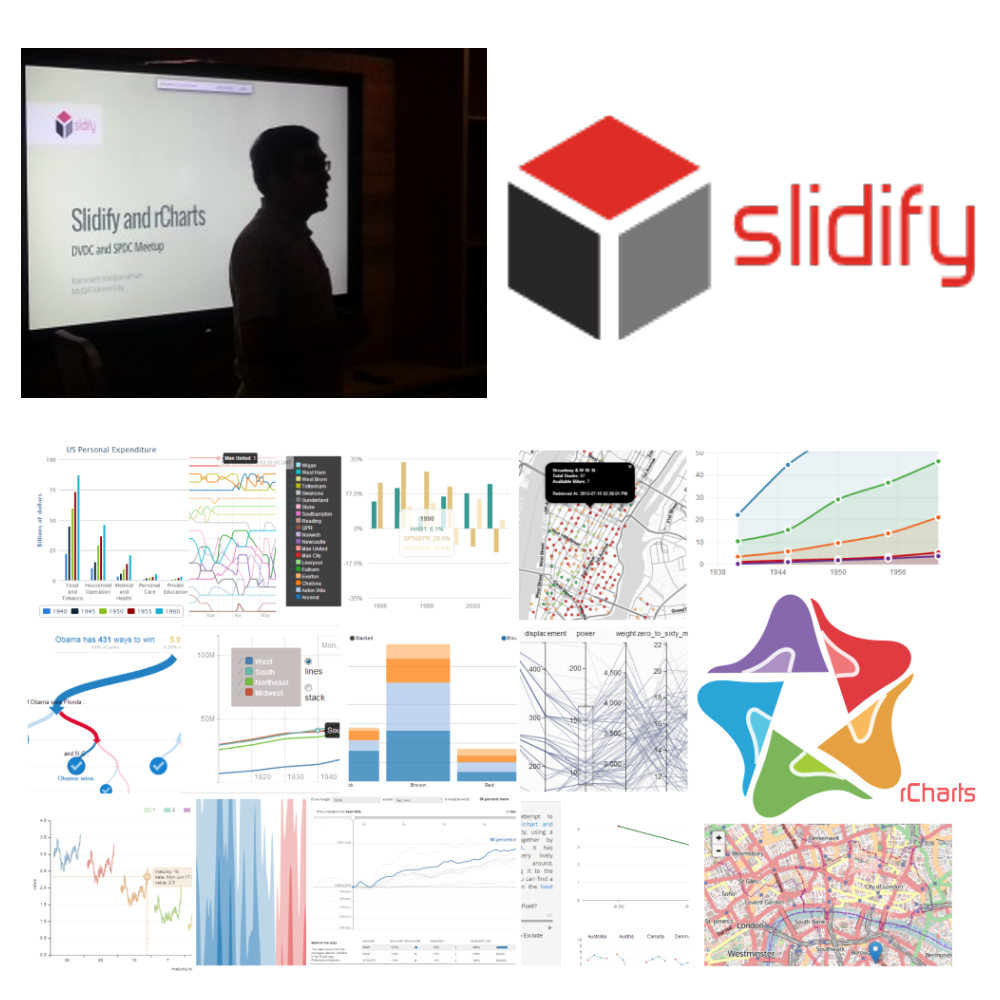
Discovering Cool Stuff from Ramnath Vaidyanathan
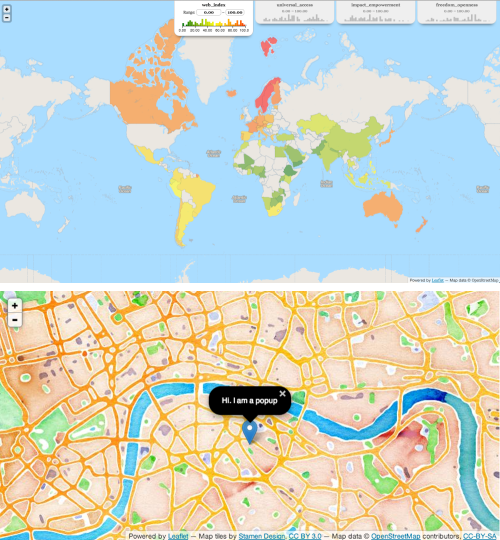
What if ... rMaps + CrimeMap?
Introducing Package 'rCrimemap'
require(devtools)
install.packages(c("ggmap", "rjson",
                   "dplyr"))
install_github('ramnathv/rCharts@dev')
install_github('ramnathv/rMaps')
Latest RStudio IDE (v0.98.501+)
install_github('woobe/rCrimemap')
rcmap(
  location = "Ball Brothers EC3R 7PP",
  period = "2014-01",
  type = "All",
  map_size = c(1000, 500),
  provider = "Nokia.normalDay",
  zoom = 10)
Introducing Package 'rCrimemap' - LondonR Demo
require(rCrimemap); rcmap("Ball Brothers EC3R 7PP");

# [rCrimemap]: Downloading '2010-12.rda' from author's Bitbucket account ...
# [rCrimemap]: Converting raw data into JSON format for Leaflet ...
# [rCrimemap]: Creating Leaflet with Heat Map ...

# [rCrimemap]: =======================================================
# [rCrimemap]: Summary of Crime Data Used and Leaflet Map
# [rCrimemap]: =======================================================

# Point of Interest           : Ball Brothers EC3R 7PP
# Police Force(s)             : Metropolitan Police Service City of London Police
# Period of Crime Records     : 2010-12
# Type of Crime Records       : All
# Total No. of Crime Records  : 93077
# Map Resolution              : 1000 x 500
Introducing Package 'rCrimemap' - LondonR Demo
rcmap("Ball Brothers EC3R 7PP",
      "2011-08", "All", c(1000,1000),
      "Nokia.normalDay")
rcmap("Manchester",
      "2014-01", "All", c(1000,1000),
      "MapQuestOpen.OSM")
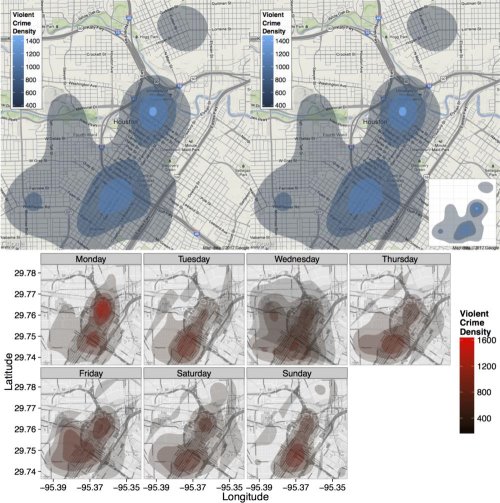
Beyond Data Points and Fancy Graphs
Related BBC Articles
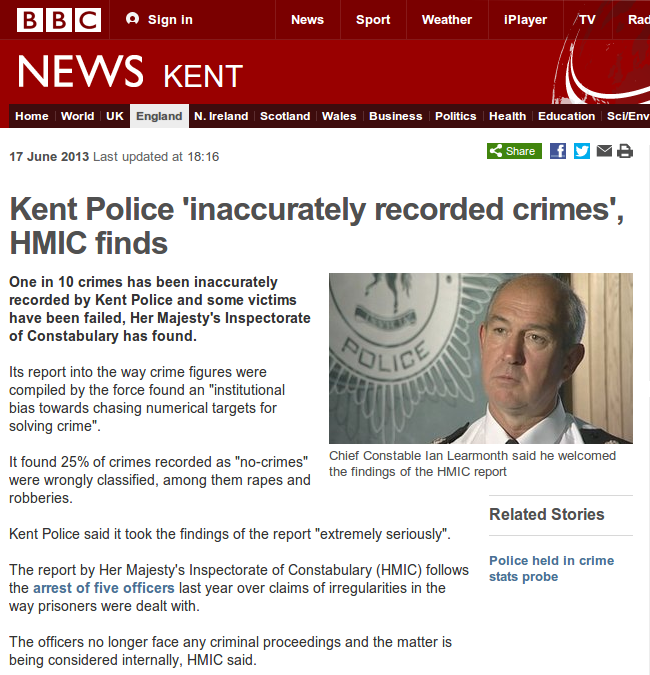
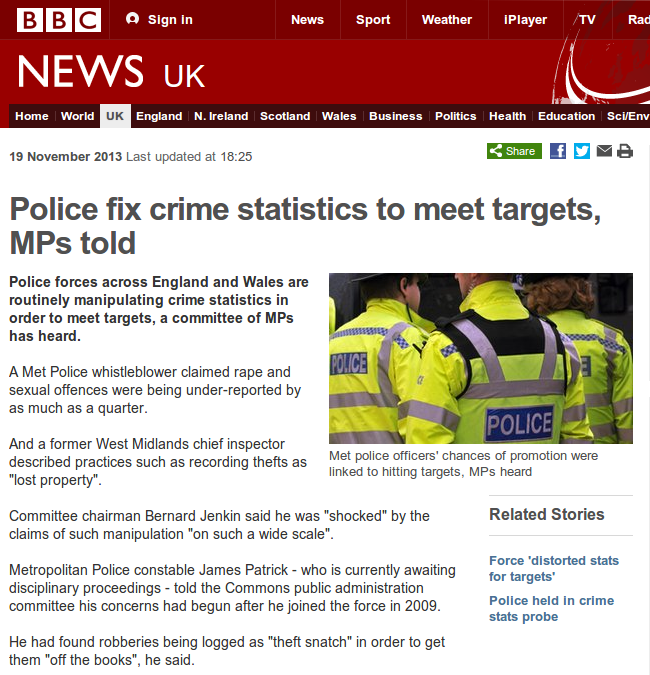
Beyond Exploratory Analysis
Can we trust the data? Can we improve the data? Can we learn from the data? Can we predict crime rate? Can we optimise the resources? Can we build a new decision support system?
Conclusions
Conclusions
Reasons why I shifted to R R is excellent for data mining, visualisation, big data, dynamic doc etc.
CrimeMap a wonderful learning experience. a case study for Shiny and ShinyApps.
Things keep evolving rMaps + CrimeMap = rCrimemap
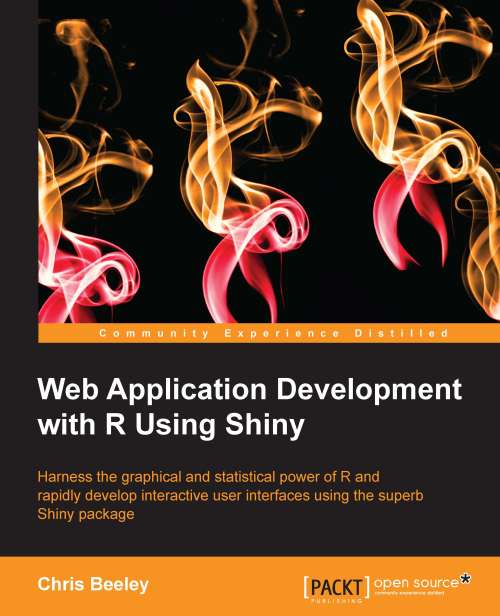
Want to Find Out More About Shiny?
RStudio's Intro, Tutorial, Showcase and ShinyApps.
Chris Beeley's LondonR Presentation (Dec 2013) and His Book.
Another three copies for LondonR members!! 
Check out my blog at 9pm GMT+0 tomorrow!
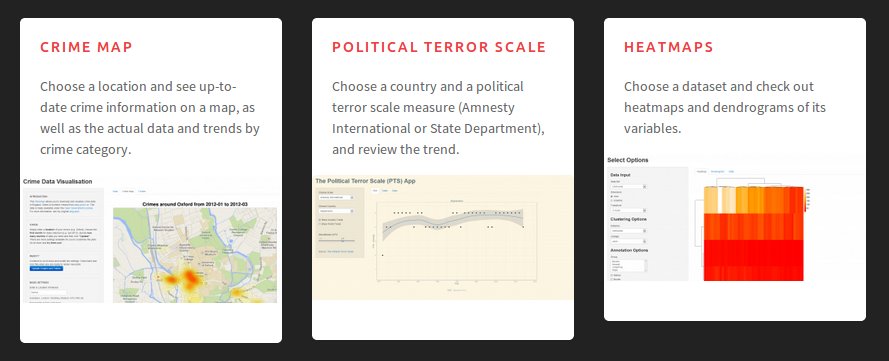
Show Me Shiny - Gallery of R Web Apps
Show Me Shiny - Gallery of R Web Apps
John M. Chambers on R
F.Y.I.
Acknowledgement
| Thanks | For |
|---|---|
Coursera & Jeff Leek |
Data Analysis Online Course |
David Kahle & Hadley Wickham |
ggmap and ggplot2 |
data.police.uk |
Open Crime Data and API |
RStudio Team (esp. Tareef Kawaf) |
RStudio IDE, Shiny & ShinyApps |
Chris Beeley & Packt |
For the Shiny Cookbook |
Ramnath Vaidyanathan |
Slidify, rCharts and rMaps |
... and, most importantly, of course ...Mango Solutions |
... kindly sponsoring and supportingLondonR since 2009! |
Thank You for Your Attention!
You can find the slides at
bit.ly/londonr_crimemap
| Other Stuff | URL |
|---|---|
CrimeMap |
bit.ly/bib_crimemap |
| CrimeMap Codes on GitHub | bit.ly/github_crimemap |
rCrimemap |
bit.ly/rCrimemap |
GitHub |
bit.ly/github_woobe |
For more information
Contact Me
| Via | URL |
|---|---|
Blog |
bit.ly/blenditbayes |
@matlabulous |
|
jofai.chow@gmail.com |
|
bit.ly/linkedin_jofaichow |
|
AboutMe |
bit.ly/aboutme_jofaichow |